Retirement planning is a very personal journey. The amount you need to save depends on your age, income, desired retirement income, inflation, and more. But it’s still worthwhile to see how you stack up to other Americans.
So what is the average retirement savings in the United States? How does the average retirement savings by age vary? Do education and race affect retirement savings? We dug into the most recent data to find out.
Average retirement savings
Median retirement savings: $87,000
The median retirement savings for American households has been growing since 1989 with few exceptions.
Americans are saving more for retirement than they did 30 years ago in spite of economic challenges.
| YEAR | MEDIAN RETIREMENT ACCOUNT SAVINGS | MEAN RETIREMENT ACCOUNT SAVINGS |
|---|---|---|
| 1989 | $25,361 | $87,721 |
| 1992 | $29,008 | $92,160 |
| 1995 | $32,902 | $110,889 |
| 1998 | $43,760 | $139,083 |
| 2001 | $49,217 | $175,587 |
| 2004 | $55,309 | $193,412 |
| 2007 | $64,395 | $210,804 |
| 2010 | $60,095 | $233,358 |
| 2013 | $75,097 | $256,023 |
| 2016 | $74,002 | $282,103 |
| 2019 | $75,348 | $295,743 |
| 2022 | $87,000 | $333,945 |
The mean retirement savings among Americans is significantly higher than the median savings, indicating some large outliers. High earners have more than $1 million more in retirement savings than lower earners, which pulls up the average retirement savings number.
Savings by age
Most retirement savings are accrued after the age of 35 (a trend that parallels the average net worth by age). Median retirement savings grow significantly every 10 years for Americans older than 35 years of age until they reach 75.
A few factors may be at play in this sharp increase -- the power of compounding interest leading to snowballing returns in 401(k)s and similar retirement investing accounts, employer matching plans kicking in, higher incomes resulting in more savings, or a combination of all three.
Average retirement savings by age (median)
| YEAR | YOUNGER THAN 35 | 35 TO 44 | 45 TO 54 | 55 TO 64 | 65 TO 74 | OLDER THAN 74 |
|---|---|---|---|---|---|---|
| 1989 | $9,222 | $23,056 | $39,195 | $55,334 | $34,584 | $36,889 |
| 1992 | $9,324 | $18,855 | $58,015 | $62,159 | $41,439 | $58,015 |
| 1995 | $11,613 | $28,257 | $54,192 | $61,934 | $56,127 | $45,483 |
| 1998 | $12,763 | $36,467 | $63,817 | $85,697 | $69,287 | $54,700 |
| 2001 | $11,718 | $47,878 | $80,355 | $92,073 | $100,444 | $80,355 |
| 2004 | $17,284 | $43,996 | $87,206 | $130,416 | $125,702 | $47,138 |
| 2007 | $13,738 | $52,947 | $90,153 | $143,100 | $110,187 | $50,085 |
| 2010 | $14,477 | $42,340 | $81,948 | $136,579 | $136,579 | $73,753 |
| 2013 | $15,274 | $54,350 | $110,736 | $132,375 | $189,652 | $87,825 |
| 2016 | $14,825 | $45,635 | $101,136 | $148,005 | $155,651 | $148,005 |
| 2019 | $15,070 | $69,552 | $115,921 | $155,334 | $190,110 | $96,214 |
| 2022 | $18,880 | $45,000 | $115,000 | $185,000 | $200,000 | $130,000 |
Average retirement savings by age (mean)
| Year | YOUNGER THAN 35 | 35-44 | 45-54 | 55-64 | 65-74 | 75 OR OLDER |
|---|---|---|---|---|---|---|
| 1989 | $21,121 | $68,589 | $120,455 | $143,664 | $113,495 | $76,011 |
| 1992 | $27,713 | $56,747 | $145,106 | $147,121 | $112,365 | $115,291 |
| 1995 | $36,499 | $69,045 | $169,122 | $181,637 | $162,292 | $114,930 |
| 1998 | $41,191 | $95,288 | $164,843 | $261,198 | $188,489 | $169,358 |
| 2001 | $31,585 | $108,605 | $212,865 | $332,177 | $292,978 | $212,370 |
| 2004 | $39,837 | $107,062 | $223,076 | $340,125 | $328,150 | $186,530 |
| 2007 | $35,744 | $114,652 | $219,847 | $387,018 | $382,057 | $151,134 |
| 2010 | $36,698 | $115,127 | $235,228 | $397,523 | $421,537 | $237,306 |
| 2013 | $36,772 | $143,211 | $222,841 | $362,765 | $563,869 | $302,404 |
| 2016 | $40,057 | $123,529 | $266,121 | $460,103 | $441,990 | $414,877 |
| 2019 | $34,970 | $152,959 | $295,273 | $473,442 | $493,897 | $414,903 |
| 2022 | $49,127 | $141,517 | $313,220 | $537,563 | $609,229 | $462,411 |
45% of Americans aged 18 to 29 have retirement savings, but only 26% feel on track
| Age | Have retirement account | Retirement savings on track |
|---|---|---|
| 18–29 | 45% | 26% |
| 30–44 | 65% | 34% |
| 45–59 | 74% | 38% |
| 60+ | 77% | 45% |
| Overall | 67% | 34% |
Americans are feeling less prepared for retirement. The percentage that feel as though their retirement savings are track fell from 40% in 2021 to 31% in 2022 and rose to 34% in 2023 per the Federal Reserve.
Federal Reserve
The older the age group, the more likely they are to have retirement savings and feel as though their savings are on track. Despite that, just 38% of those aged 45 to 59 and only 45% of those 60 and over felt prepared.
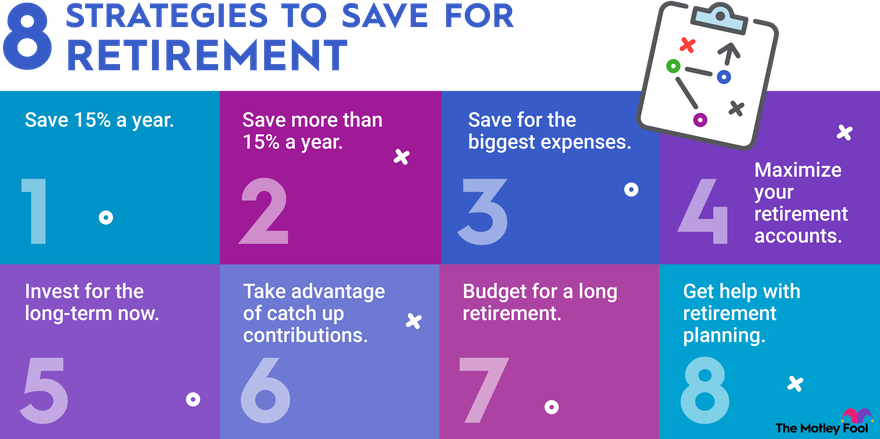
The Motley Fool recommends putting aside 15% of your annual income for retirement over the course of your career. That may sound like a lot but it’s a goal to work towards. At a minimum, if you participate in a company-sponsored retirement plan, you should try to take full advantage of the company’s matching contributions.
61% of non-retirees have a 401(k) or 403(b), 20% have no retirement savings
That only 61% of non-retirees have a 401(k) or 403(b) and 16% don't have any retirement savings at all is troublesome.
While Social Security is an important social program, it's designed to replace only 40% of the average salary after retirement. Unfortunately, one in five married retired couples and 45% of single retirees depend on Social Security benefits for more than 90% of their income in retirement.
To continue living a lifestyle consistent with the one they had before retirement, retirees need to rely on their own savings as well as Social Security benefits.
The most common form of retirement savings are defined contribution pensions, like 401(k)s and individual retirement accounts (IRA).
| Assets | Non-retirees | Retirees | Overall |
|---|---|---|---|
| Tax preferred retirement account (401(k), IRA) | 61% | 57% | 60% |
| Define benefit pension through employer | 21% | 51% | 29% |
| Tax preferred retirement account or pension | 64% | 73% | 64% |
| Own home | 58% | 82% | 64% |
| Savings or money market account or CD | 54% | 70% | 58% |
| Stocks, bonds, ETFs, or mutual funds outside retirement account | 31% | 45% | 35% |
| Cash value in life insurance policy | 23% | 31% | 25% |
| Business or real estate | 9% | 16% | 11% |
| Have tax-preferred retirement account, pension, or other assets listed above | 84% | 92% | 86% |
This dataset doesn't differentiate between traditional IRAs, Roth IRAs, and other options – it's good to know the different types of IRAs and which is best for your situation.
Retirement savings by education
Average retirement savings by education
Educational attainment has a dramatic impact on retirement savings.
The median retirement account value for someone with no high school diploma was $50,000 in 2022, nearly $100,000 less than someone with a college degree.
The impact of educational attainment on retirement savings has become more pronounced over the past 30 years.
In 1989, Americans with a college degree had saved about $16,000 more than those with no high school diploma, who had saved $23,056 in the median.
By 2022, the median retirement account value of Americans without a high school diploma had roughly doubled. Meanwhile, the average retirement savings of those with a college degree more than tripled.
Average retirement savings by level of education (median)
| YEAR | NO HIGH SCHOOL DIPLOMA | HIGH SCHOOL DIPLOMA | SOME COLLEGE | COLLEGE DEGREE |
|---|---|---|---|---|
| 1989 | $23,056 | $18,445 | $18,445 | $39,195 |
| 1992 | $14,504 | $20,720 | $24,864 | $47,655 |
| 1995 | $18,387 | $29,031 | $30,967 | $49,547 |
| 1998 | $21,880 | $30,632 | $36,467 | $74,392 |
| 2001 | $16,741 | $30,133 | $35,155 | $93,748 |
| 2004 | $19,484 | $31,425 | $37,711 | $113,132 |
| 2007 | $21,465 | $41,499 | $51,516 | $114,480 |
| 2010 | $22,262 | $34,145 | $40,974 | $122,921 |
| 2013 | $17,820 | $42,258 | $52,186 | $133,647 |
| 2016 | $44,401 | $44,401 | $41,935 | $144,304 |
| 2019 | $23,184 | $46,368 | $47,527 | $137,945 |
| 2022 | $50,000 | $44,000 | $53,000 | $141,700 |
Average retirement savings by level of education (mean)
| YEAR | NO HIGH SCHOOL DIPLOMA | HIGH SCHOOL DIPLOMA | SOME COLLEGE | COLLEGE DEGREE |
|---|---|---|---|---|
| 1989 | $65,117 | $50,546 | $61,224 | $135,605 |
| 1992 | $32,029 | $57,791 | $56,973 | $142,927 |
| 1995 | $41,686 | $71,209 | $86,919 | $173,081 |
| 1998 | $41,986 | $74,017 | $92,712 | $238,444 |
| 2001 | $61,022 | $83,101 | $112,592 | $290,032 |
| 2004 | $48,864 | $93,747 | $120,483 | $312,250 |
| 2007 | $75,358 | $95,819 | $134,231 | $348,275 |
| 2010 | $48,138 | $103,337 | $123,712 | $389,823 |
| 2013 | $50,149 | $110,774 | $151,949 | $396,430 |
| 2016 | $164,632 | $120,988 | $158,320 | $425,872 |
| 2019 | $78,491 | $138,924 | $158,209 | $441,872 |
| 2022 | $79,983 | $141,899 | $177,831 | $476,375 |

Retirement savings by race
Average retirement savings by race
It’s well-documented that race can play a decisive factor in income and other measures of financial well-being. That's true when it comes to retirement savings as well.
White Americans had a median average retirement account value of $100,000 in 2022 -- $61,000 more than Black Americans and $46,600 more than Hispanic Americans.
Similar to the impact educational attainment has on retirement savings, the median value of retirement savings for white Americans has grown faster than Black and Hispanic Americans since 1989.
Average retirement savings by race or ethnicity (median)
| YEAR | WHITE, NON-HISPANIC | BLACK, NON-HISPANIC | HISPANIC | OTHER |
|---|---|---|---|---|
| 1989 | $27,667 | $13,834 | $9,914 | $14,364 |
| 1992 | $31,080 | $11,396 | $13,468 | $41,439 |
| 1995 | $35,031 | $15,483 | $23,225 | $30,967 |
| 1998 | $47,407 | $20,057 | $20,057 | $36,467 |
| 2001 | $58,927 | $14,230 | $16,741 | $45,200 |
| 2004 | $64,422 | $23,569 | $23,569 | $50,281 |
| 2007 | $75,843 | $37,206 | $24,327 | $45,220 |
| 2010 | $73,753 | $24,584 | $24,584 | $53,266 |
| 2013 | $96,735 | $24,184 | $20,493 | $55,368 |
| 2016 | $94,970 | $30,464 | $28,368 | $64,135 |
| 2019 | $92,736 | $40,572 | $35,935 | $54,483 |
| 2022 | $100,000 | $39,000 | $55,600 | $60,000 |
Average retirement savings by race or ethnicity (mean)
| YEAR | WHITE, NON-HISPANIC | BLACK, NON-HISPANIC | HISPANIC | OTHER |
|---|---|---|---|---|
| 1989 | $92,433 | $42,924 | $56,849 | $72,417 |
| 1992 | $98,974 | $40,657 | $32,294 | $100,715 |
| 1995 | $119,488 | $43,198 | $74,583 | $101,175 |
| 1998 | $147,543 | $58,634 | $83,160 | $166,548 |
| 2001 | $196,225 | $53,981 | $67,946 | $165,462 |
| 2004 | $214,868 | $93,842 | $62,133 | $136,315 |
| 2007 | $240,462 | $97,768 | $92,995 | $118,183 |
| 2010 | $264,388 | $72,148 | $89,290 | $200,846 |
| 2013 | $301,164 | $71,666 | $50,430 | $168,010 |
| 2016 | $321,811 | $92,173 | $118,689 | $257,232 |
| 2019 | $341,030 | $126,513 | $124,044 | $225,316 |
| 2022 | $380,333 | $117,527 | $120,318 | $257,358 |
White Americans are also more likely to have retirement savings than Black and Hispanic Americans and were likewise more likely than those two groups to feel as though their retirement savings are on track.
Asian Americans were the most likely to have retirement savings and feel as though their savings are on track.
| Race/ethnicity | Any retirement savings | Retirement savings on track |
|---|---|---|
| Asian | 77% | 40% |
| White | 57% | 25% |
| Black | 51% | 21% |
| Hispanic | 52% | 46% |
Related retirement topics
By percentile of net worth
Average retirement savings by net worth
It’s no surprise that higher-net-worth-individuals have more retirement savings. What is notable is that the growth in retirement savings for the highest-net-worth individuals has significantly outpaced growth among lower-net-worth individuals over the past 30 years.
Median retirement savings among the top 10% of net worth individuals has grown by more than 700% since 1989.
Meanwhile, individuals who fall into the bottom 25% in terms of net worth have seen just a 160% increase in their net worth, showing that growing income inequality has long-term effects even after Americans are done working.
That gap is even more striking when you consider that the individuals in the bottom 25% of net worth had a median retirement account value of $2,306 in 1989, while those in the top 10% of net worth had a median retirement account value of $110,668.
For the bottom 25%, a 160% change resulted in an increase of just $3,694 in retirement savings. For the top 10%, median retirement savings grew by $789,332.
Average retirement savings by percentile of net worth (median)
| YEAR | LESS THAN 25TH PERCENTILE | 25TH TO 49.9TH PERCENTILE | 50TH TO 74.9TH PERCENTILE | 75TH TO 89.9TH PERCENTILE | 90TH TO 100TH PERCENTILE |
|---|---|---|---|---|---|
| 1989 | $2,306 | $8,531 | $23,056 | $57,640 | $110,668 |
| 1992 | $2,072 | $8,702 | $27,557 | $60,709 | $155,398 |
| 1995 | $2,323 | $13,935 | $31,741 | $67,740 | $193,543 |
| 1998 | $3,829 | $14,769 | $51,053 | $109,400 | $233,387 |
| 2001 | $3,348 | $12,555 | $50,222 | $133,925 | $334,813 |
| 2004 | $4,714 | $18,384 | $53,423 | $152,414 | $421,102 |
| 2007 | $4,293 | $21,465 | $71,550 | $171,720 | $453,341 |
| 2010 | $6,829 | $16,390 | $55,998 | $181,650 | $564,072 |
| 2013 | $6,110 | $15,274 | $66,187 | $210,017 | $572,775 |
| 2016 | $5,303 | $18,501 | $64,135 | $244,207 | $778,257 |
| 2019 | $5,448 | $22,025 | $67,929 | $222,567 | $811,444 |
| 2022 | $6,000 | $22,380 | $80,000 | $269,000 | $900,000 |
Average retirement savings by percentile of net worth (mean)
| YEAR | LESS THAN 25TH PERCENTILE | 25TH TO 49.9TH PERCENTILE | 50TH TO 74.9TH PERCENTILE | 75TH TO 89.9TH PERCENTILE | 90TH TO 100TH PERCENTILE |
|---|---|---|---|---|---|
| 1989 | $5,354 | $13,258 | $40,460 | $90,085 | $261,816 |
| 1992 | $4,458 | $13,721 | $40,054 | $88,211 | $303,048 |
| 1995 | $7,090 | $20,398 | $43,835 | $112,391 | $384,914 |
| 1998 | $7,938 | $22,852 | $66,602 | $143,541 | $485,027 |
| 2001 | $6,274 | $23,433 | $72,196 | $190,312 | $635,642 |
| 2004 | $8,206 | $26,750 | $75,867 | $211,799 | $684,930 |
| 2007 | $10,340 | $30,604 | $92,516 | $227,178 | $782,674 |
| 2010 | $15,741 | $24,964 | $77,100 | $227,261 | $876,353 |
| 2013 | $13,370 | $23,536 | $87,611 | $245,776 | $919,568 |
| 2016 | $13,335 | $26,880 | $89,760 | $284,464 | $1,077,011 |
| 2019 | $13,090 | $31,913 | $91,197 | $282,299 | $1,097,003 |
| 2022 | $12,739 | $33,851 | $106,233 | $328,642 | $1,296,683 |
56% of all retirees use a pension or retirement plan as a source of income
Investment accounts can be a powerful tool in planning for retirement, especially if consumers start investing early and make use of employer matches, if available.
57% of retirees use some sort of pension plan (which, in this dataset, includes defined benefit pensions, 401(k)s, 403(b)s, and similar accounts) for retirement income.
Pension
It was not surprising that 77% of retirees used Social Security as a source of retirement income, and 92% of those over 65 did so. Social Security benefits are meant to replace 40% of your annual salary in retirement, which is why preparing for retirement through saving and investing is so important.
| Source of income in the past 12 months among retirees | Retirees age 65 or older | All retirees |
|---|---|---|
| Social Security (including Old-Age and Disability Insurance) | 92% | 77% |
| Pension | 64% | 56% |
| Interest, dividends, or rental income | 52% | 48% |
| Wages, salaries, or self-employment | 26% | 33% |
| Cash transfers, other than Social Security | 5% | 8% |
Retirement age: 51% of Americans retire at 61 or younger
Data shows that, in 2019, 51% of Americans retired at 61 or earlier, and 23% retired between 62 and 64, before Medicare coverage kicks in at 65.
And, despite white Americans having higher retirement savings on average, their average retirement age tends to be higher than Black and Hispanic Americans.
| Race/ethnicity | 61 or earlier | 62 to 64 | 65+ |
|---|---|---|---|
| White | 48% | 24% | 27% |
| Black | 56% | 23% | 17% |
| Hispanic | 65% | 19% | 15% |
| All | 51% | 23% | 24% |
Make a retirement plan and stay the course
Attaining a comfortable retirement is generally a matter of planning ahead -- deciding how much to save and invest in a retirement fund each month -- and then sticking to that plan.
The data reveals that the majority of American households follow that path and have a retirement fund available to them once they’ve hung up the boots and retired.
But there’s room for improvement in retirement planning and saving. A quarter of non-retirees have no retirement savings. Thankfully, it’s never too late to start saving for retirement, and there are ways to catch up if you feel like you’ve fallen behind.
Preparing for retirement is full of questions that don’t have simple answers. The Motley Fool has resources (including multiple retirement calculators) to help you take your first steps towards a comfortable retirement, but it’s always a good idea to consult a financial advisor to get personalized advice that fits your financial situation and goals.
Expert advice on retirement
Sources
- Federal Reserve (2023). "Survey of Consumer Finances."
- Federal Reserve (2024). "Report on the Economic Well-Being of U.S. Households in 2023."
The Motley Fool has a disclosure policy.