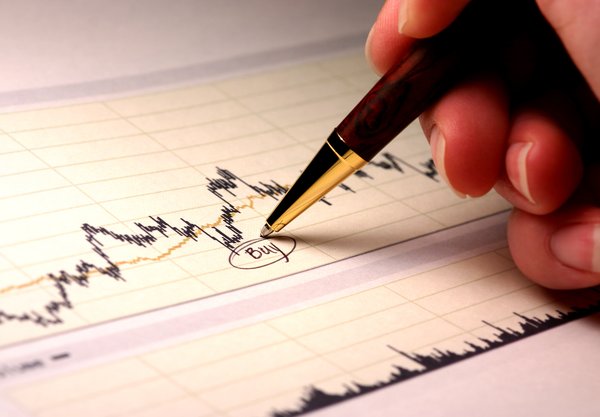
Investors use a variety of approaches to managing their portfolios. One such approach is technical analysis. Technical analysis of stocks uses data on past price movements and overall market sentiment to attempt to predict future changes in a stock's price.
Making correct assumptions about the future is part of successful investing, so it's no surprise that some investors are drawn to technical analysis to make investment decisions. This guide will cover how technical analysis works, its limitations, and whether it's worth using.

What is it?
What is technical analysis?
Technical analysis is a strategy for making stock investing decisions based on a company's past share price movements, trading volumes, and investor sentiment. Technical analysts take the position that factors such as sales growth, profitability, debt and cash on the balance sheet, and the industry in which a company operates are already priced into the company's shares.
If two very different companies happen to have similar historical charts, a technical analyst might predict a similar future price outcome for each. Technical analysts believe that price patterns repeat themselves and that recognizing them is the best way to beat the stock market's average returns.
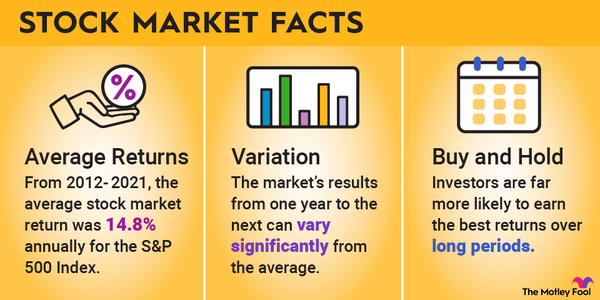
Returns
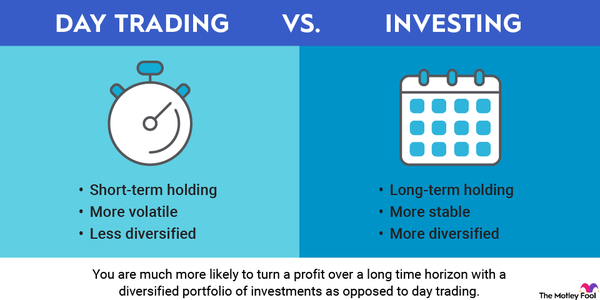
Traders often use technical analysis to attempt to profit from short-term volatility in a stock's price. These traders focus on gauging market sentiment and identifying patterns in charts that have occurred in the past and could repeat in the near future.
Limitations
Technical analysis limitations
Though some technical analysts beat the market over time, various studies indicate that the vast majority of technical analysis produces results little better than a coin flip. Over the short term -- minutes, days, weeks, or even months -- stock price movements are binary, meaning the likelihood of the price moving either up or down is about 50/50.
Charts can also give off wrong signals about future price movements. They don't automatically consider events such as quarterly earnings reports, which can cause unpredictable price movements. Political changes and other business announcements that can affect an industry and a company are also not factored into technical analysis.
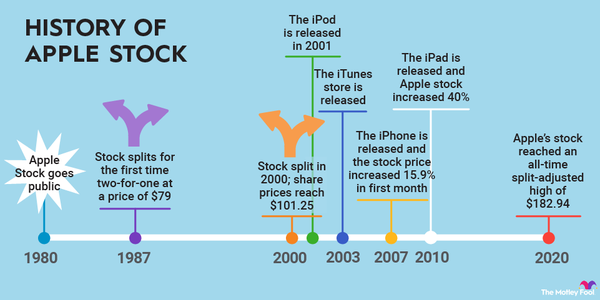
Short-term charts don't hold much value for long-term investors seeking companies to own for years or even decades. Had you invested in Amazon (AMZN -2.58%) shortly after its initial public offering (IPO) in 1997, whether you invested when the stock's price was $2 or $2.50, you'd be happy either way today.
Also, past performance is not indicative of future results. Despite many years of rapid profitability gains, Amazon may start to plateau in the next 10-year stretch.
Technical vs. fundamental
Technical analysis versus fundamental analysis
Investors are generally divided into two main camps: technical analysts and fundamental analysts.
Fundamental analysts evaluate stocks based on industry and business fundamentals. Secular growth trends, such as those occurring in digital advertising, cloud computing, and streaming TV, are relevant to fundamental analysis, as are a company's revenue growth, net income or free-cash-flow growth, and its prospects within its industry. Fundamental analysts look at financial metrics like the price-to-sales (P/S) ratio and price-to-earnings (P/E) ratio.
Cloud Computing
Fundamental analysis evaluates the success of a company's new projects or acquired businesses, whether a company becomes more efficient as it grows, and many other factors. Meanwhile, technical analysis can indicate how good a company is at increasing its profit margins.
Investors who favor fundamental analysis believe a business with a long track record of increasing profitability will likely continue to do so and that the company's share price will rise in tandem with that increasing profitability.
Owning shares of a company represents an ownership stake in the business, which includes a claim to part of that company's future cash flows. Fundamental analysis projects and assesses these future cash flows to identify a mismatch between a company's likely future value and its current stock price. For fundamentalists, that mismatch represents a buying opportunity.
Some investors use a blend of fundamental and technical analyses. After identifying a company they like, they might try to time their purchase using charts and past data to buy at the best price possible.
How is it used?
How is technical analysis used?
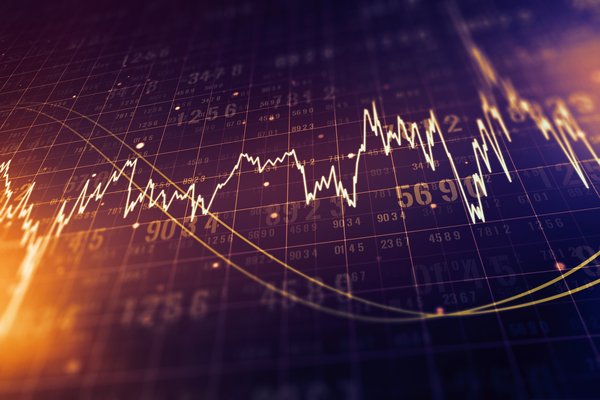
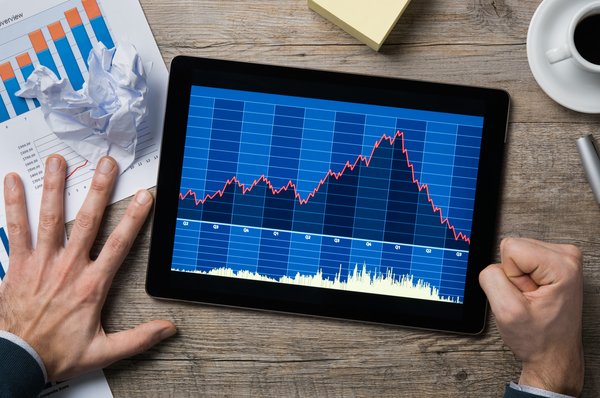
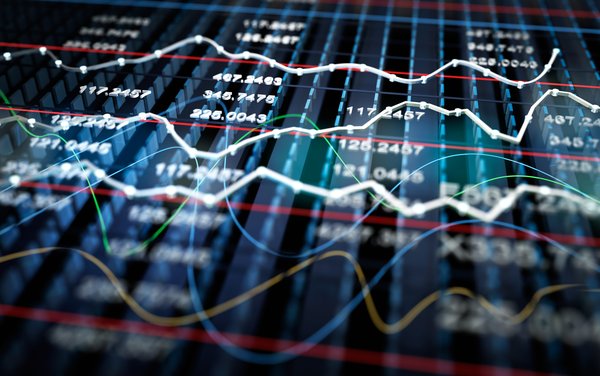
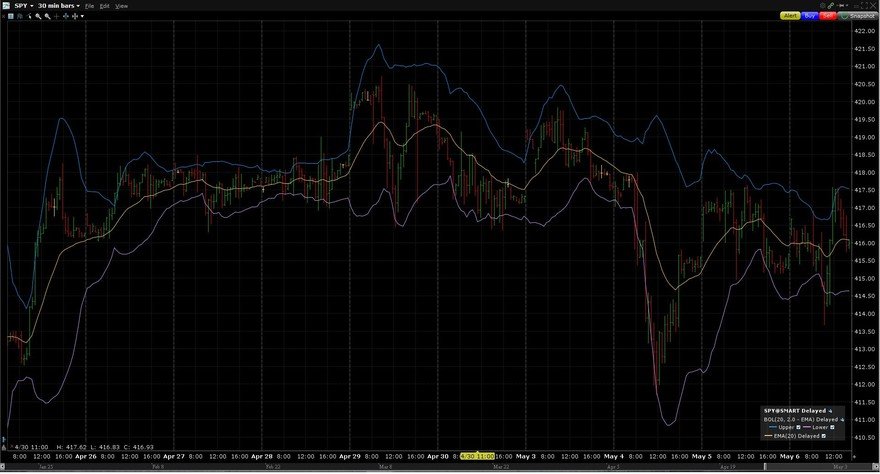
As a simple example, a technical analyst might use a chart like the one above to assess when to buy or sell the SPDR S&P 500 ETF (SPY -2.14%).
A chartist might reason that the exchange-traded fund (ETF) is "overbought" when the price reaches the upper end of the band and decide to sell. They might also consider the ETF "oversold" when the price reaches the lower end of the band, indicating it's time to buy.
Exchange-Traded Fund (ETF)
The best path to long-term growth
The Motley Fool does not use technical analysis to predict stock price movements. Technical analysis might have merit for some traders, but the most sustainable path to long-term investing success does not include short-term chart reading. Investors who own stocks of companies for long periods of time view short-term technical analysis as a distraction.
Related investing topics
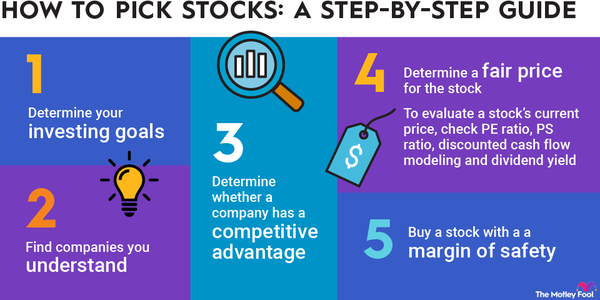
Focusing on fundamentals such as revenue and profit growth -- indicators that a company operates in an industry with above-average growth -- or on signs that a company has a competitive advantage are all consistent with long-term wealth building. Focusing on long-term trends is the best and most sustainable path to achieving your financial goals.